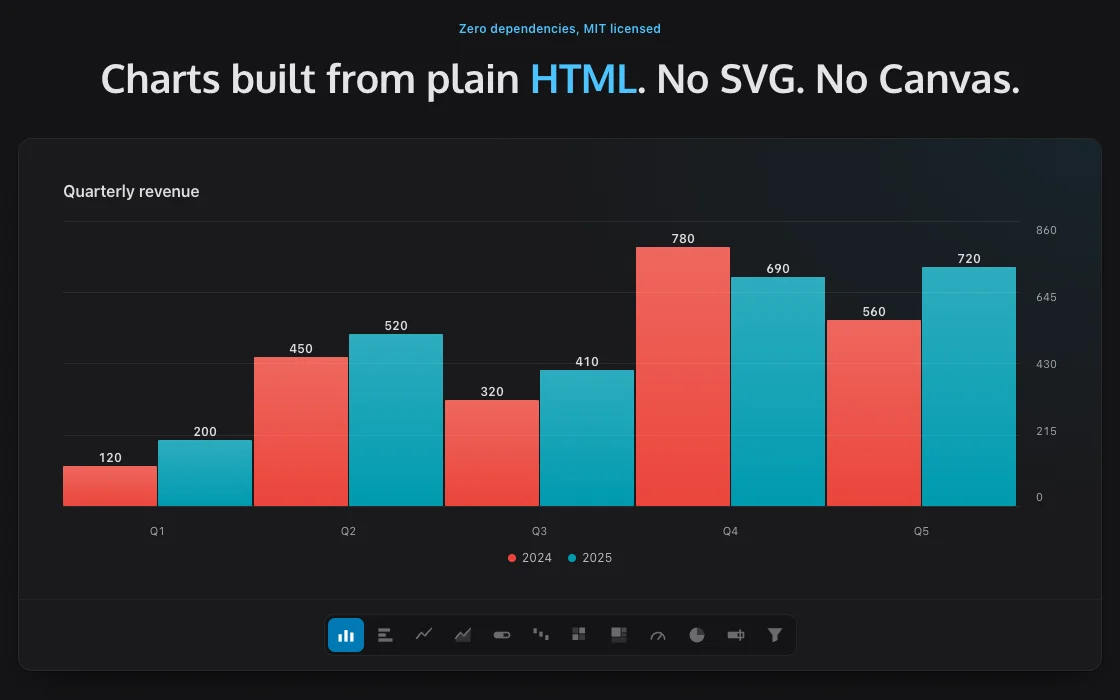
Neo Charts started in 2017 as a small jQuery plugin for bar and column charts, and in 2020 I updated it with the version I was using in Pagelocity. In 2026 I rebuilt it without jQuery and grew it from two chart types to twelve.
It avoids SVG and Canvas on purpose. When a chart is made of ordinary elements, it responds to the same CSS as the rest of the page: themes, hover states and layout just work, and there’s no drawing API to learn.
A full review in July fixed 73 issues across accessibility, correctness and performance. The newest features, such as pies, donuts, funnels, the editor and the accessibility work, are live on the demo site and in the repository. npm still has v1.1.1, from before those changes.
- Chart typesColumns, bars, lines, areas, progress, waterfalls, gauges, heatmaps, treemaps, pies and donuts, bullets and funnels
- StylingReal DOM nodes with predictable classes (
.nc-item,.nc-label) and CSS variables for theming - AccessibilityA hidden data table for screen readers, keyboard navigation, reduced-motion support and text colors picked by real WCAG contrast
- EditorA live chart editor to try every option before writing code
- InstallTwo files with a
<script>tag, ornpm install neo-charts